Lower Trophic Level Monitoring on Lake Erie

  • Two people working in the front of a boat. One holds a net and a bottle of reddish liquid. The other is holding a cable and instrument and writing on a datasheet

    1/14

    From 2008-2018, the GLC was part of a long-term monitoring project on Lake Erie. Several state and federal agencies in the US and Canada sample at sites around the lake. The GLC collected data every two weeks at two stations near Buffalo, NY. Here are Mark Clapsadl and Kit Hastings sampling zooplankton and profile data.

    Download Image
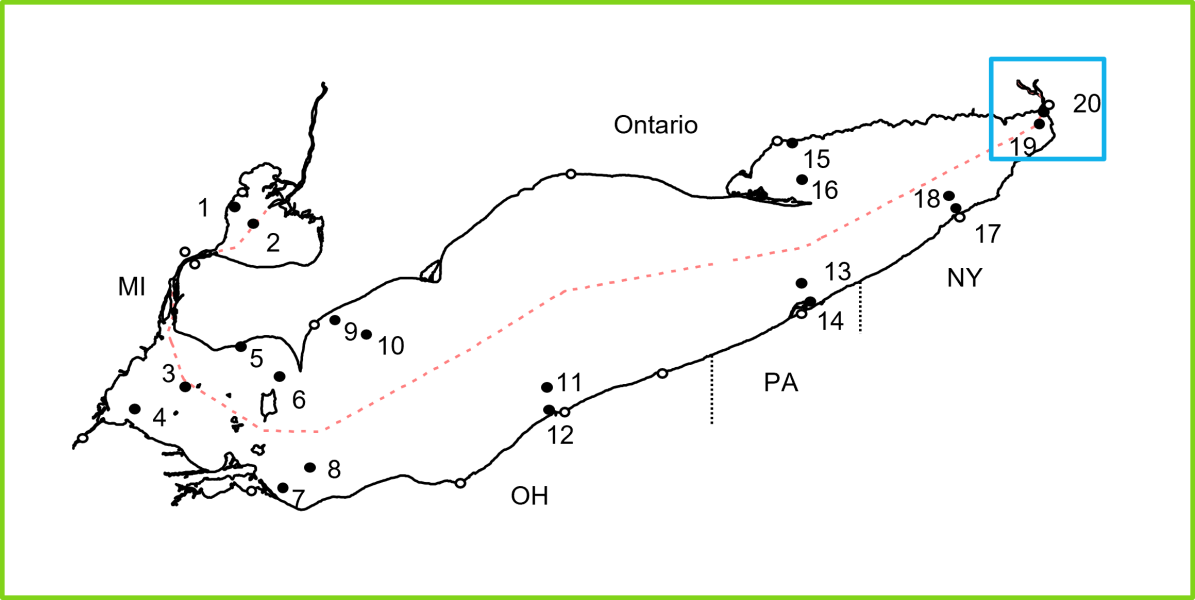
  • map of Lake Erie with 20 stations around the margins of the lake, highlighted 19 and 20 at the extreme eastern end

    2/14

    A map of Lake Erie, showing the 20 sampling sites of the Lower Trophic Level Assessment. The two sites in the blue box are maintained by Great Lakes Center staff. (Image credit: Lake Erie Forage Task Group, 2009)

    Download Image
  • A person in a life jacket sits at the edge of a boat with an instrument, a datasheet, and a pencil

    3/14

    Kit Hastings using a data sonde to collect a vertical profile of the water column. Kit is the main researcher on this project.

    Download Image
  • A person in a life jacket sits at the edge of a boat with an instrument in their lap. They are writing on a datasheet.

    4/14

    Kit Hastings recording data from the sonde.

    Download Image
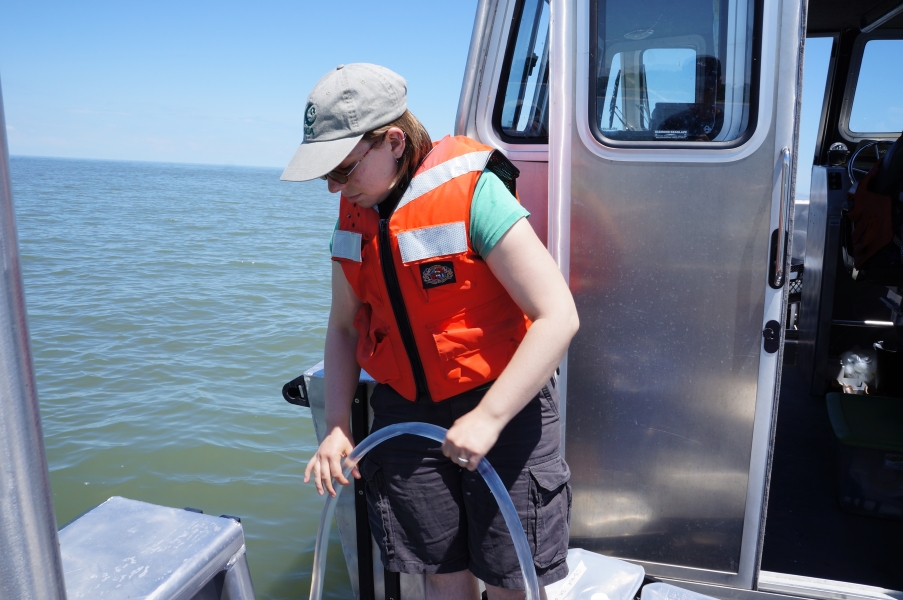
  • A person in a life jacket lowers a tube over the side of a boat

    5/14

    Kit Hastings collects a water sample using a sampling tube.

    Download Image
  • A person in a life jacket lines up bottles on the deck of a boat. There is a tub with a tube in it, and two other buckets nearby.

    6/14

    Mark Clapsadl setting up bottles for chlorophyll samples. Visible are the water sampling tube, a ponar dredge sampler, and a water bucket for the integrated water sample that the chlorophyll and phytoplankton samples are taken from.

    Download Image
  • A person in a life jacket pours water from a bucket into bottles lined up on the deck of a boat

    7/14

    Mark Clapsadl pouring water into bottles for chlorophyll analysis. We use opaque brown bottles to reduce exposure to light that could alter the amount of chlorophyll.

    Download Image
  • A person in a life jacket on a boat holds up a round net and looks at a device in the mouth of the net

    8/14

    Mark Clapsadl using a zooplankton net with a flow meter.

    Download Image
  • A person in a life jacket on a boat pours water from one jar into another.

    9/14

    Mark Clapsadl pouring a zooplankton sample from the net into a bottle.

    Download Image
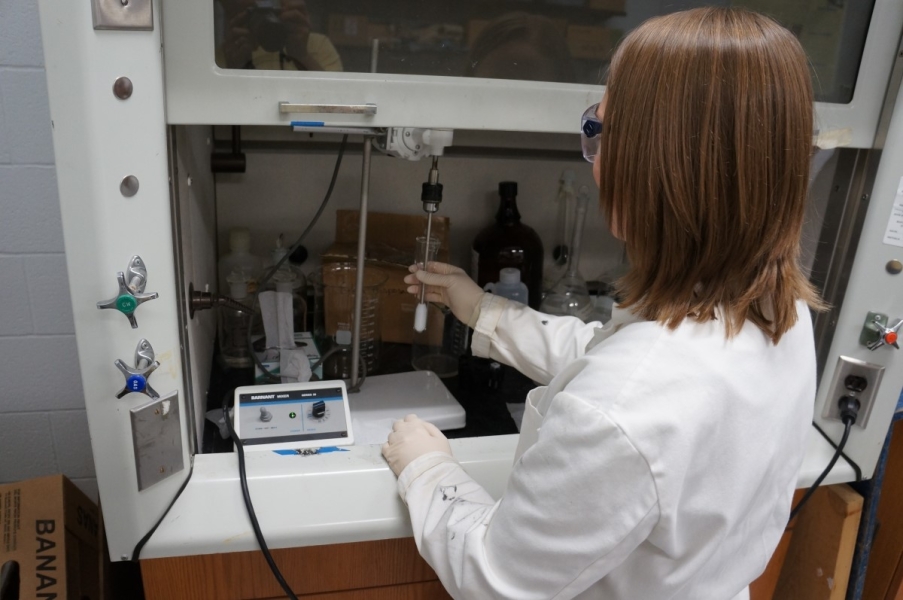
  • A person in a lab coat stands at a fume hood, holding a grinding tube with a pestle connected to a motor

    10/14

    To determine chlorophyll a concentration, Kit Hastings filters the water samples to extract the chlorophyll, then grinds sample filters in an acetone solution.

    Download Image
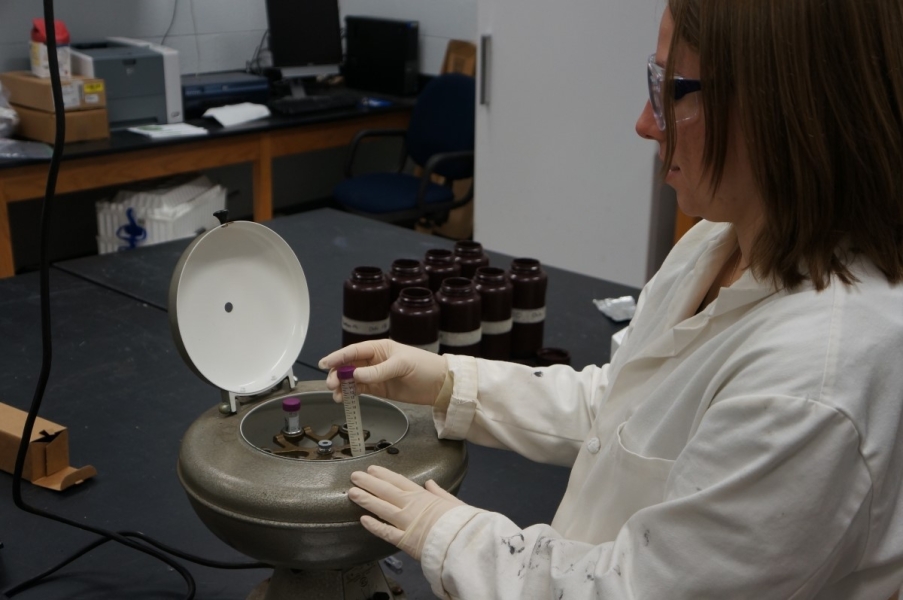
  • A person in a lab coat puts a sample tube in a centrifuge

    11/14

    The chlorophyll samples are centrifuged to settle all of the filter fibers out.

    Download Image
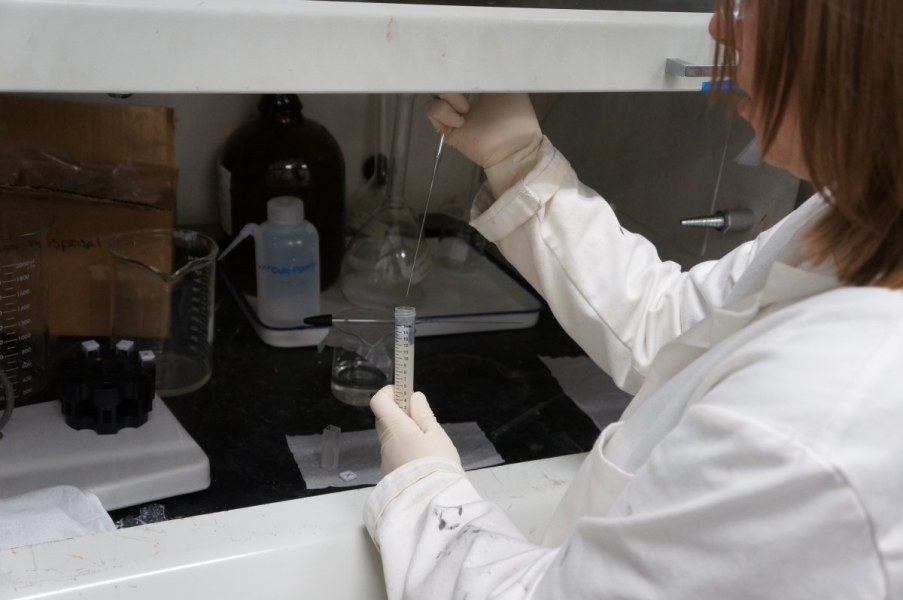
  • A person in a lab coat works at a fume hood, pipetting a liquid from a sample tube into a cuvette

    12/14

    The clarified sample is decanted into a cuvette.

    Download Image
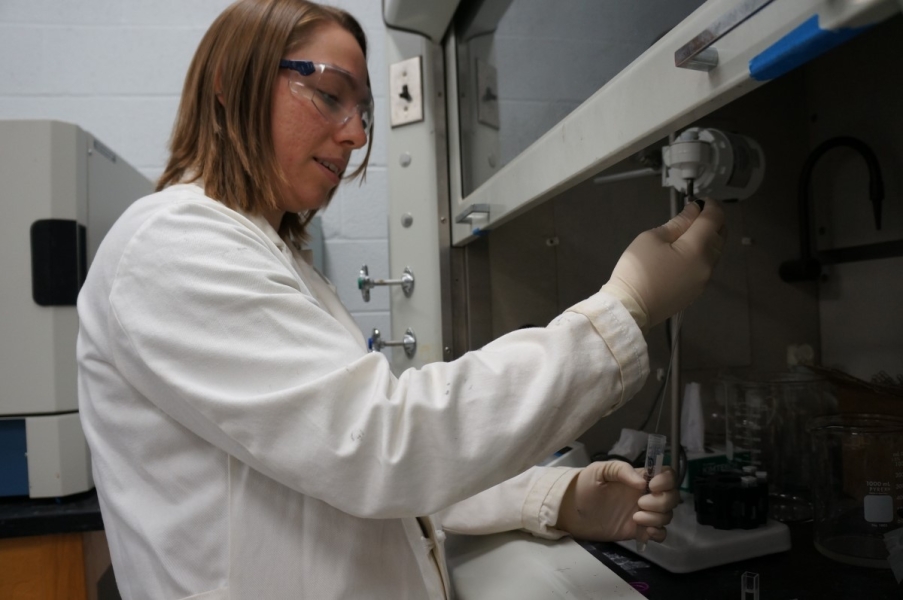
  • A person in a lab coat concentrates and works at a fume hood, pipetting a liquid from a sample tube into a cuvette

    13/14

    Kit decants the sample into spectrophotometer cuvettes.

    Download Image
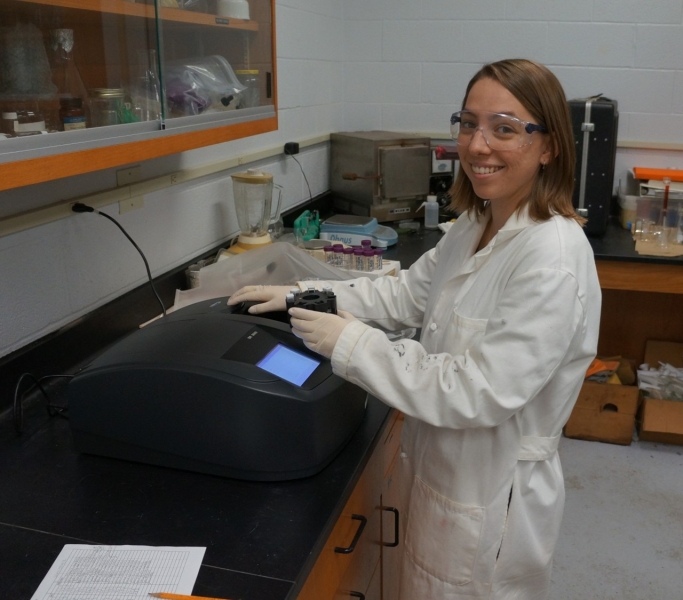
  • A person wearing a lab coat, safety glasses, and gloves stands next to an instrument with a screen on a counter in a lab, holding a carousel with cuvettes

    14/14

    Kit places extracted chlorophyll samples in the spectrophotometer to determine the chlorophyll a concentration in the water samples.

    Download Image