
written by graduate student Alexander Krest
Combined sewer overflows (CSOs) and sanitary sewer overflows (SSOs) are detrimental events that may release hundreds of millions of gallons of untreated and partially treated sewage into WNY waterways. These discharges pose a multi-dimensional threat, impacting local economies, regional ecology, and public health. Unfortunately, despite a couple highly publicized events, there is still a lack of attention paid to this issue. In 2013, New York State passed the Sewage Pollution Right to Know Act (SPRTK), which requires publicly owned wastewater treatment facilities to report discharges of untreated or partially treated sewage to the DEC. While this legislation is a step in the right direction, the sheer number of incidences coupled with varied reporting strategies and messy database configuration make the prospects of working with this data quite intimidating. Looking at sewage discharge reports for Erie County for the month of September 2019, this project aimed to gauge the potential of displaying this data through GIS applications for public, municipal, and scientific consumption.
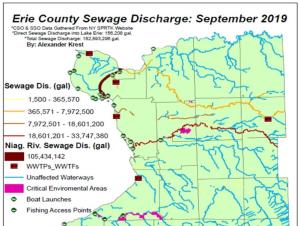
To accomplish this project, I began by gathering data for sewage discharges from the NYDEC’s historical (SPRTK) excel spreadsheet and sorted the information by impacted waterbody. Then, through the creation, collection, and implementation of GIS datasets, I was able to highlight certain areas of interest including public boat launches, public fishing access points, responsible wastewater treatment facilities, and DEC designated critical environmental areas within Erie County.
While I believe that the map turned out cleanly and displayed data in a way that’s easier to digest when compared to the raw data spreadsheet, it is somewhat limited in the scope of true data representation. For example, wastewater treatment plants associated with sewage discharges were displayed instead of the plethora of actual discharge points. Another issue was the large number of available hydrography datasets that each have varying lists of independent waterways and variable lengths of these waterways, making it difficult to get the whole picture.
However, with the threat of sewage overflows to increase based on future climate models, and little near future hope of severely reducing such events, the need to effectively communicate this data will surely grow. The use of GIS in this manner should ultimately aid municipalities and concerned citizens in visualizing sewage discharges throughout their community. This format can also be transformed across spatial and temporal scales to investigate events such as these across the globe (where data is available). What was once a large, almost incomprehensible dataset has been displayed in a relatively easily distinguishable manner, that with continued enhancements, can provide for quick and impactful understanding of a region’s wastewater management situation.
Special thanks to Dr. Tao Tang for his instruction and support.
Image caption: Erie County Sewage Discharge Map for September 2019 developed by Alexander Krest
Some content on this page is saved in PDF format. To view these files, download Adobe Acrobat Reader free. If you are having trouble reading a document, request an accessible copy of the PDF or Word Document.
